Advanced usage
Instead of reading data from a folder, you can add data to the cycad object directly. You can also read out the correlation matrices and plot them separately.
Once read, raw in situ data is stored in the cycad.df attribute as a pandas dataframe. The first column is the x-axis and the subsequent columns represent individual 1-D data series. You can also add a dataframe to the cycad object directly:
import cycad as cycad
run = cycad()
run.df = example_dataframe
1-D electrochemical data is stored in the cycad.df_echem dataframe as a single-row, multi-column dataframe. You can pass a single-column dataframe to the cycad object using cycad.cycad.read_echem_df() method, or add it directly as a transpose of a column.
run.read_echem_df(example_dataframe)

# or alternatively
run.df_echem = example_dataframe.T
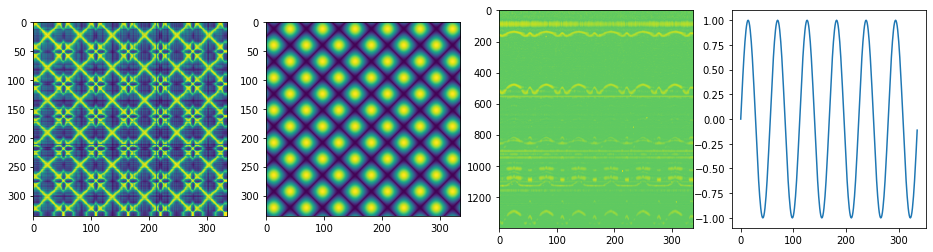
After generating the correlation matrices, you can access them directly for plotting:
fig, axes = plt.subplots(1,4, figsize=(16,4))
axes[0].imshow(run.correlation_matrix)
axes[1].imshow(run.correlation_matrix_ec)
axes[2].imshow(run.df, aspect='auto', norm=LogNorm())
axes[3].plot(run.df_echem.T)
plt.show()
In a complex pattern, it might be useful to obtain correlations from smaller regions of the data (for example, if diffraction from both anode and cathode are present). In this case, the built in df.corr() dataframe method can be used to obtain the correlations in a smaller regions of the data.
windowed_matrix = run.df[100:200].corr()
The cycad.plot() method can also be used to plot the matrices but first the new correlation matrix must be added to the cycad object. In the above case, this could be used: run.correlation_matrix = windowed_matrix. An use case might be to generate a series of correlation matrices from different regions of the data:
k = 10 # number of regions
n = run.df.shape[0]//k # calculate window size
windowed_matrices = [run.df[i*n:(i+1)*n].corr() for i in range(k-1)]